I studied algorithms to model and characterize complex networks applied to air transportation, road networks, and commuting networks.
I used the Reality Mining dataset, which followed ninety-four subjects using mobile phones that recorded and sent the researcher data about call logs, Bluetooth devices in proximity of approximately five meters, cell tower IDs, application usage, and phone status. Subjects were observed using these measurements over the course of nine months and included students and faculty from two programs within MIT. These data also reports self-reported relational data from each individual, where subjects were asked about their proximity to, and friendship with, others.
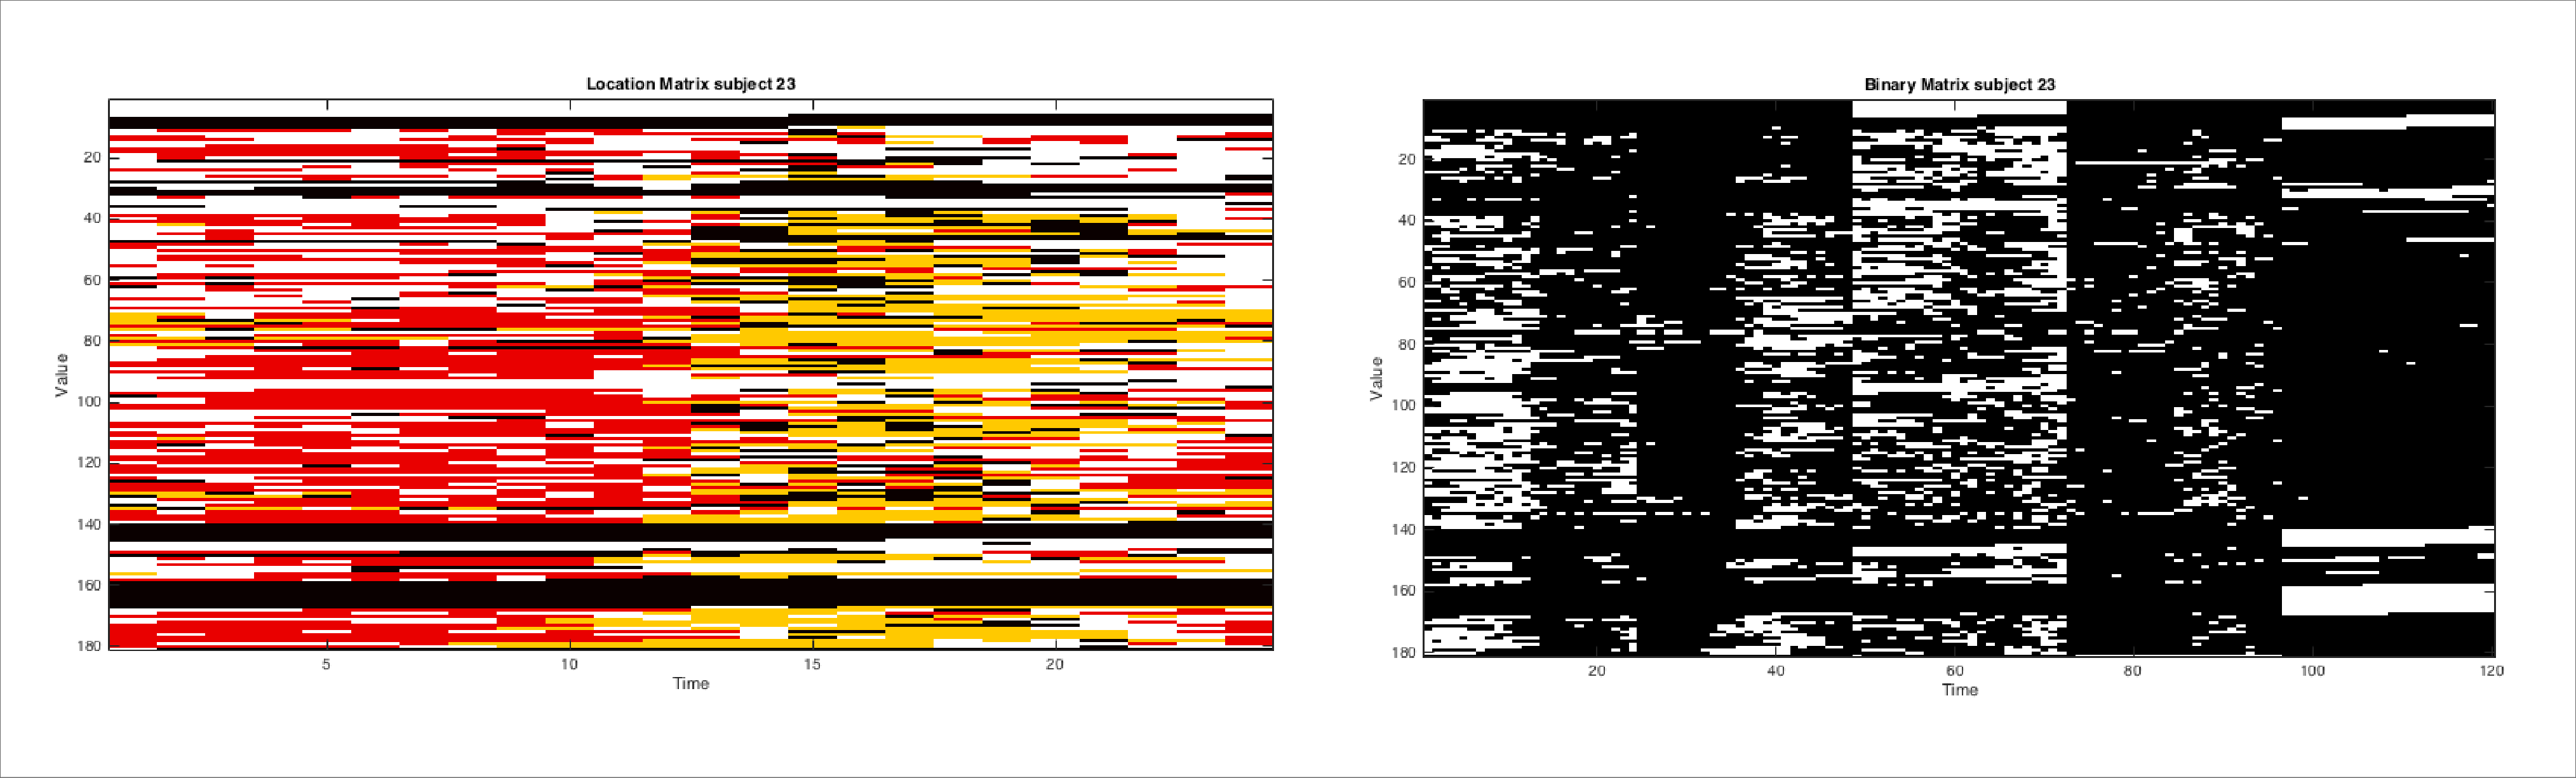 — Location matrix for subject 23
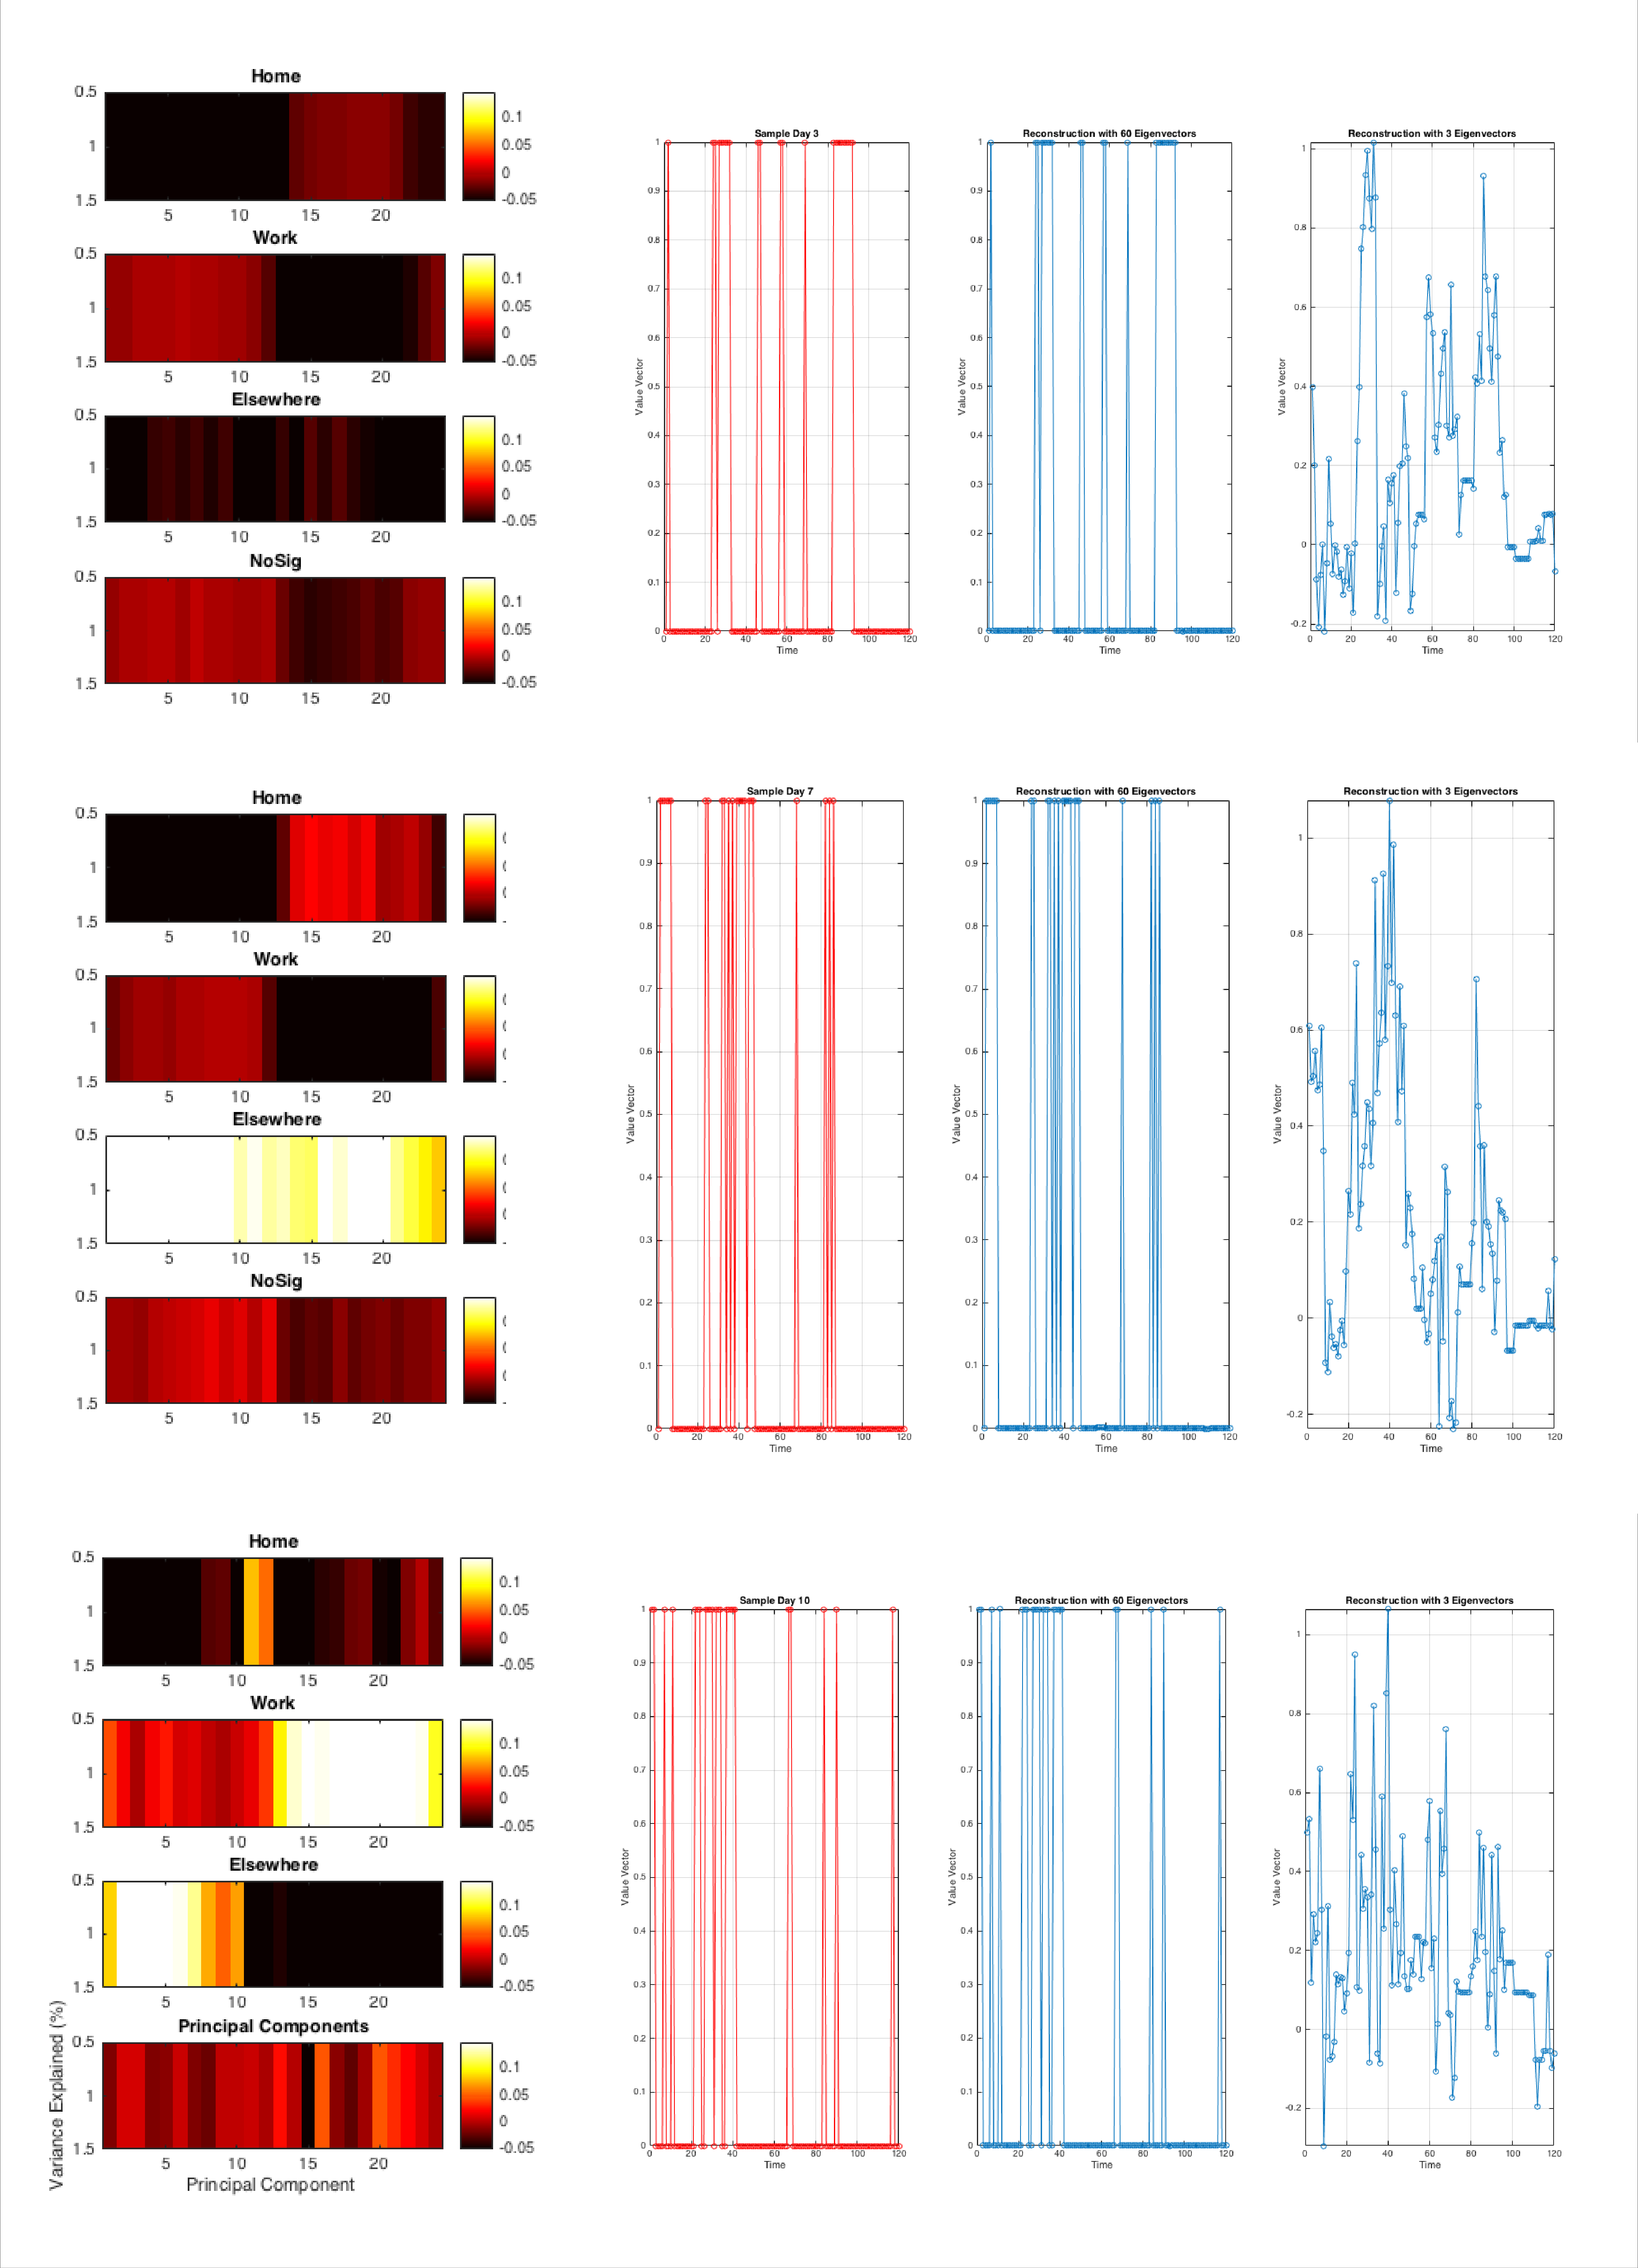 — Eigenvectors for subject 23 compared to the behaviors seen in 3 sample days.
Eigenvectors 1, 2, and 3 show that behavioral variation can be better predicted for the individual during the morning hours, when at the office. Eigenvector 3 shows the time spent "elswhere", which shows that the subject doesn’t have a clearly defined routine. The first 2 eigenvectors show that morning hours were spent mostly in work. For midday and afternoon hours, the eigenvectors capture the time spent at the office and with less clarity the time spent at home. The daily routine changes of subject 23 are also shown in the sample days 3, 7 and 10. The differences in the routine of each day are a plausible explanation for why the 3 eigenvectors reconstruct a typical day so poorly.
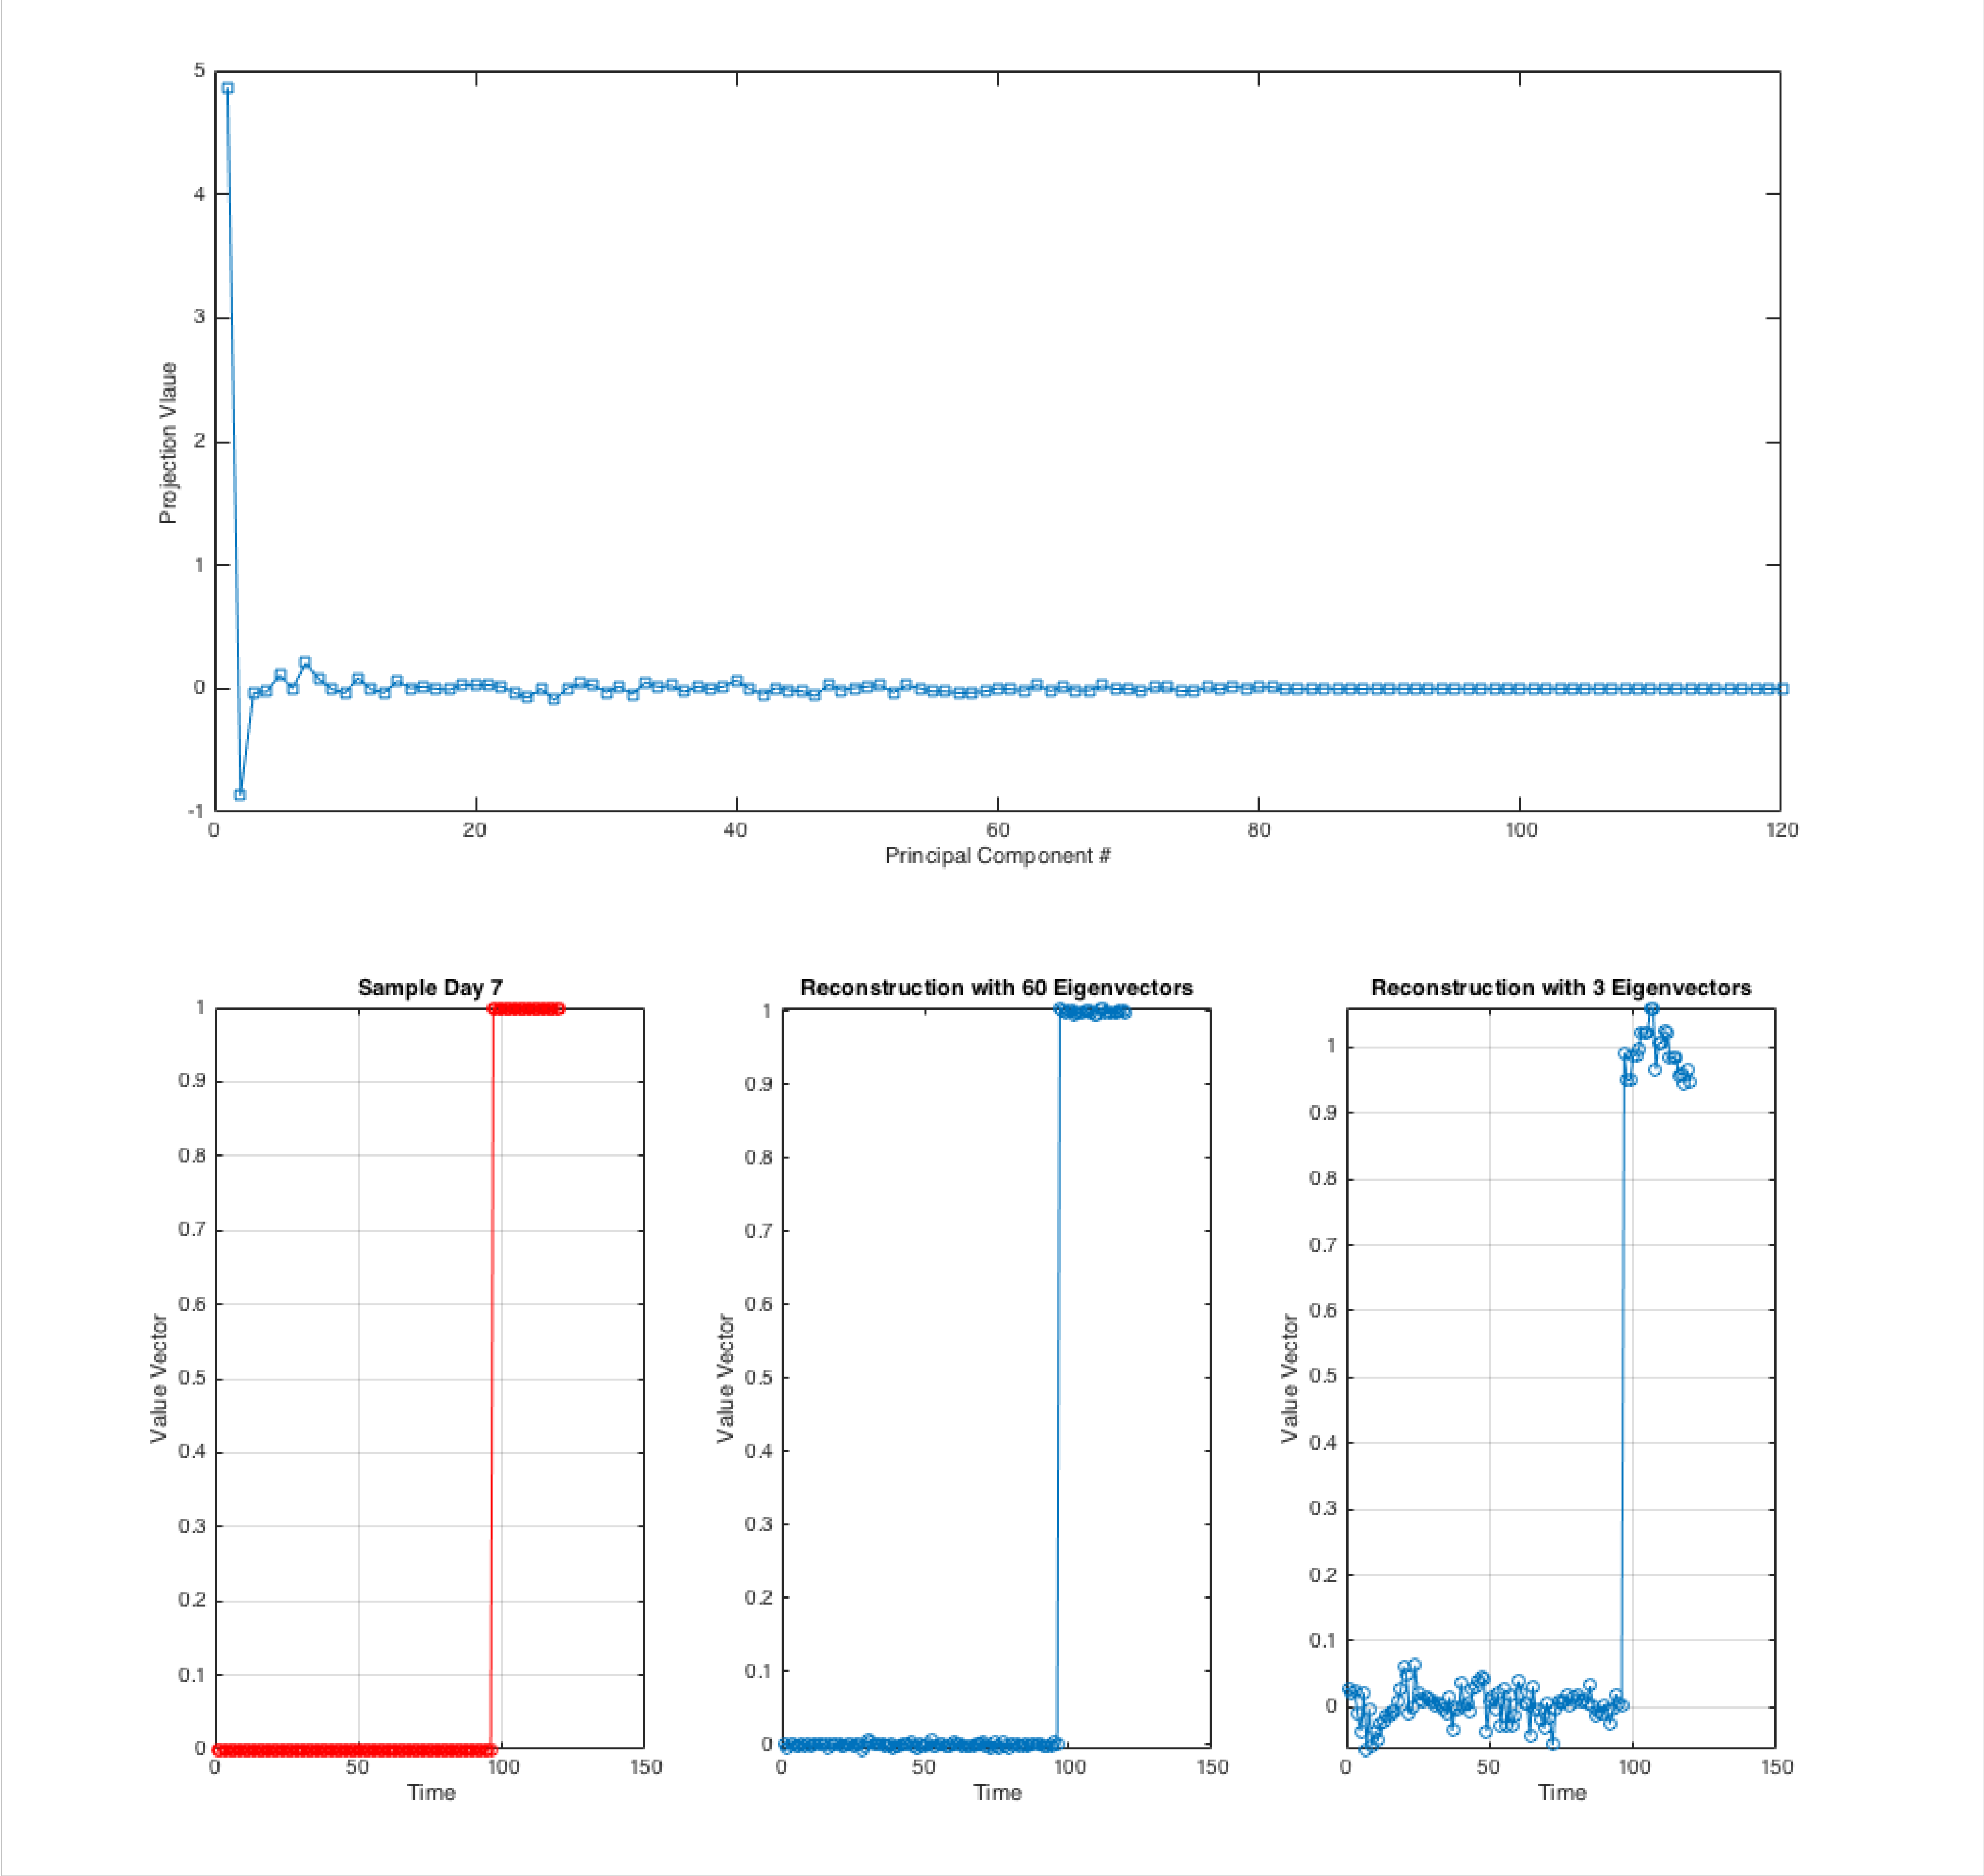 — Eigenvector reconstruction
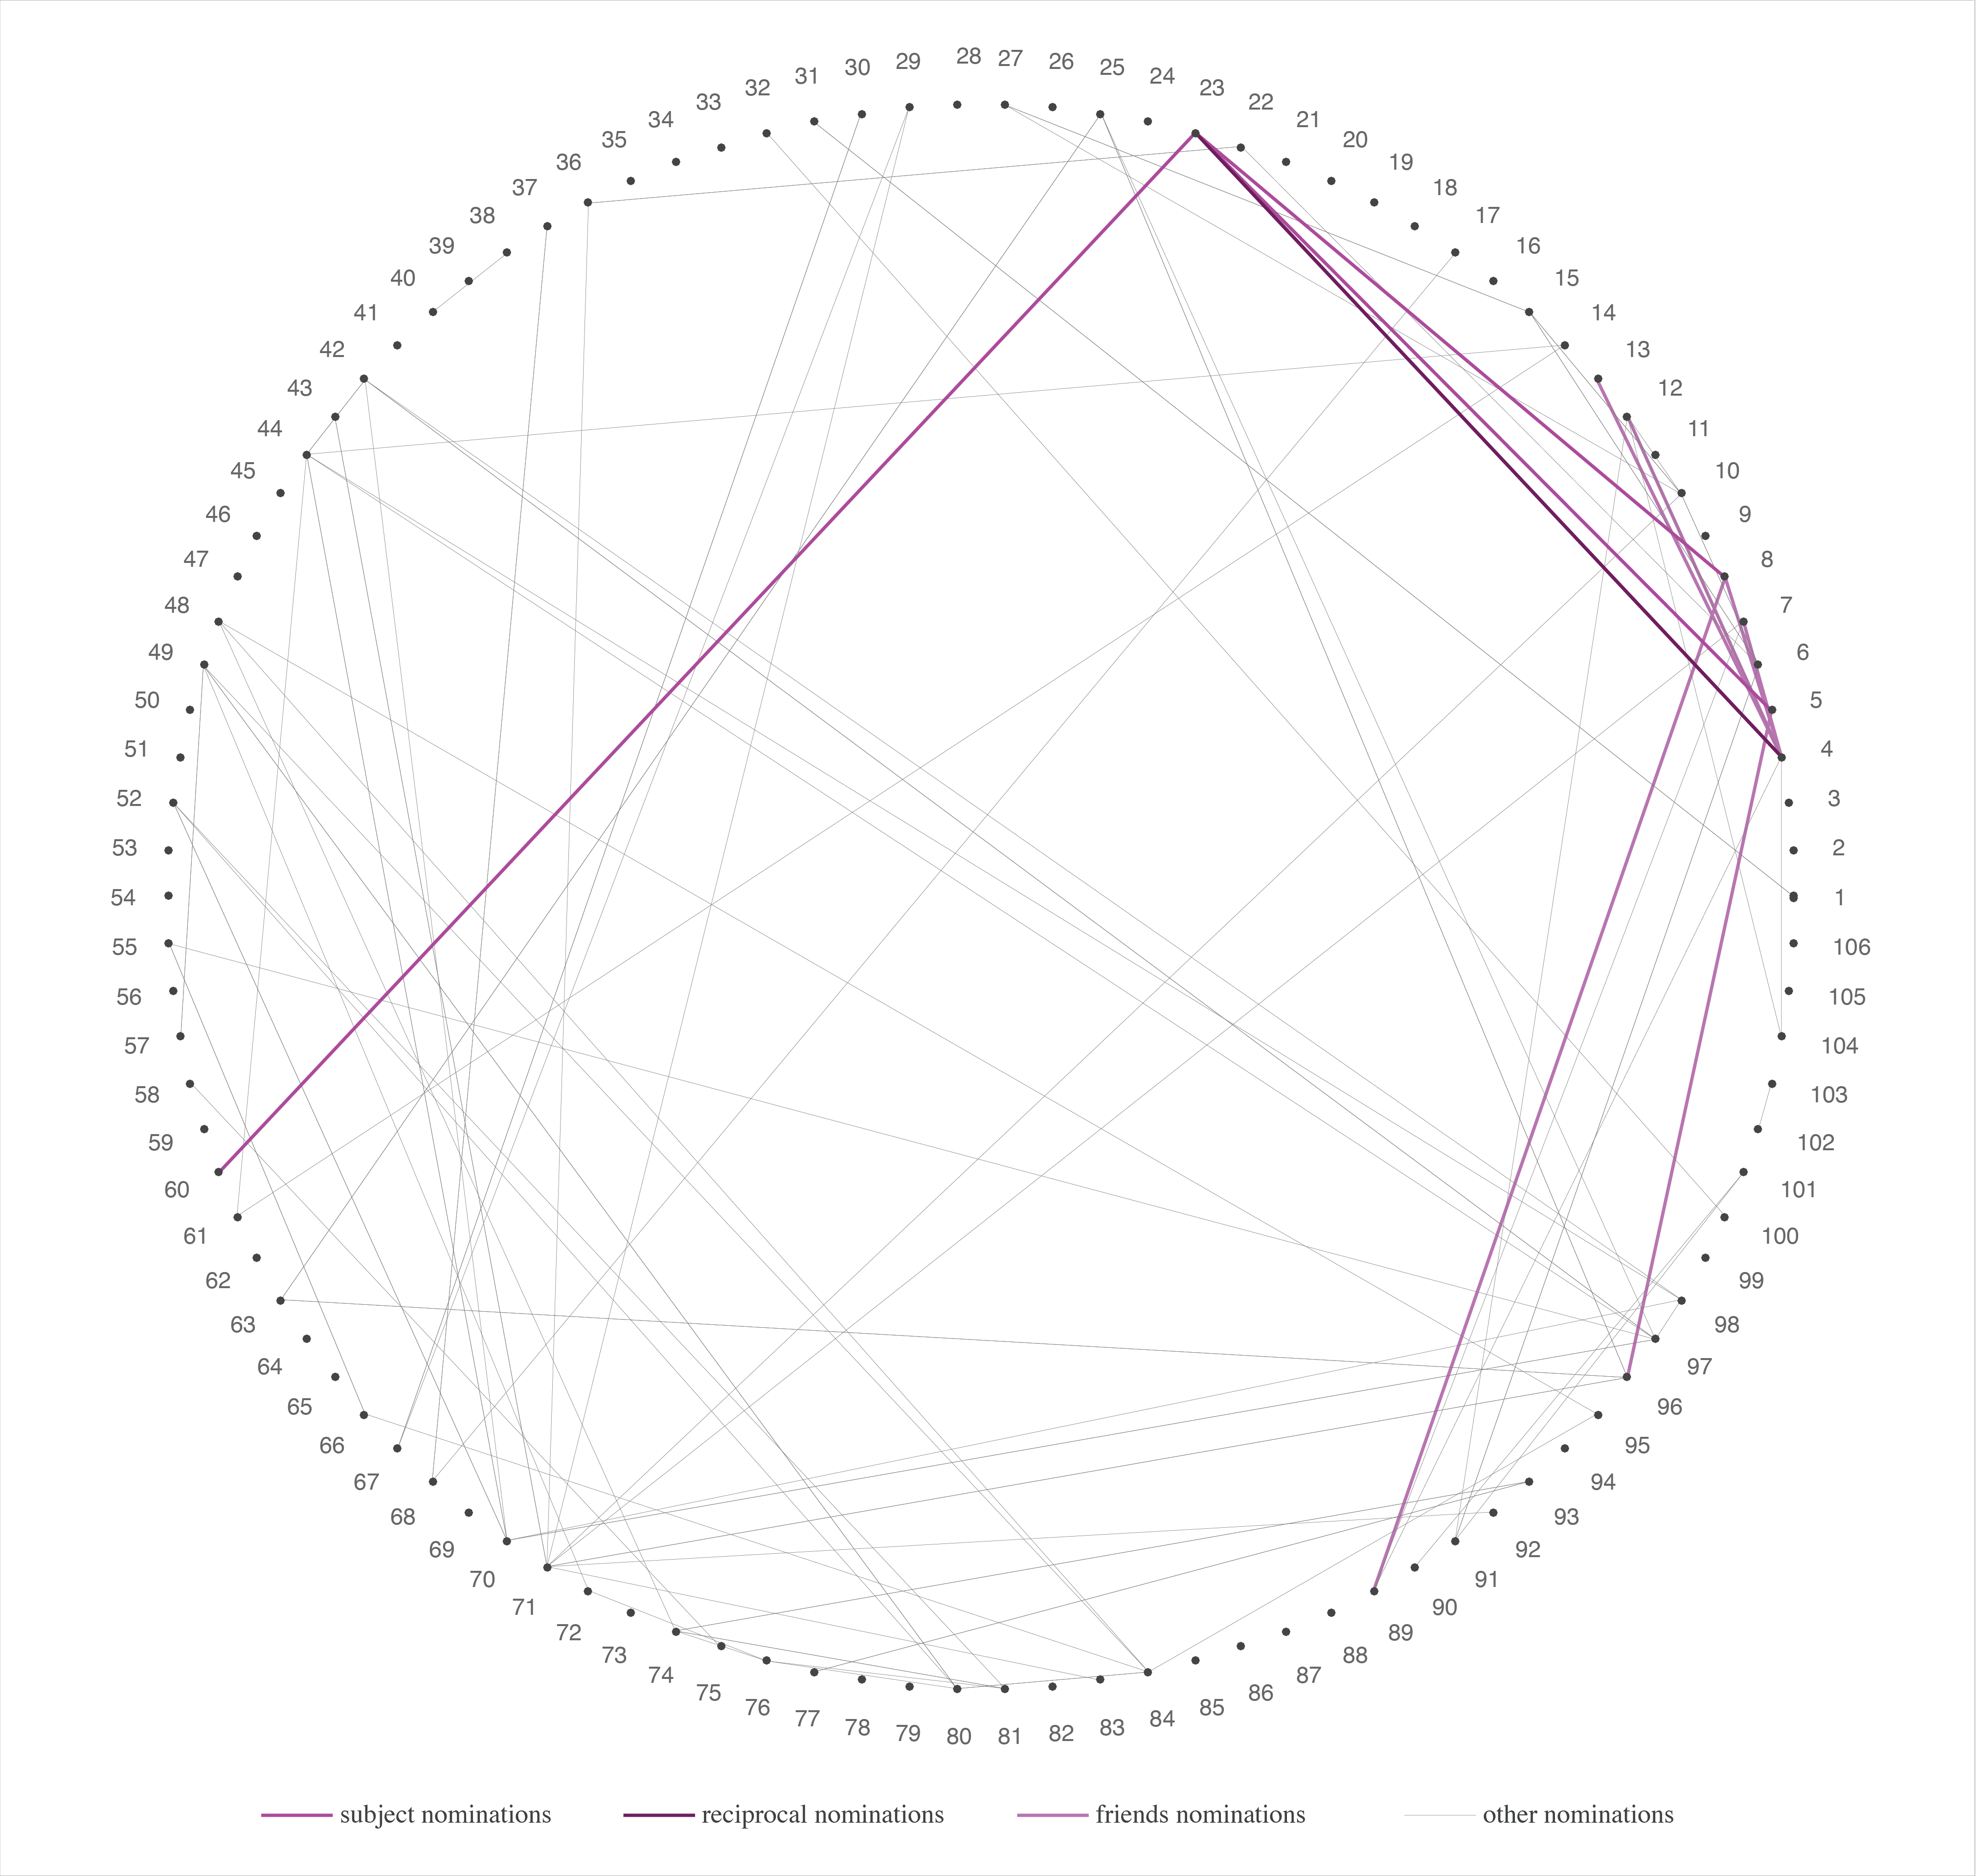 — Small network with the friends nominated by subject 23
Subject 23 nominated number 4, 5, 8, 23 and 60.